SIP — Systematic Investment Plan — is a method of investing a fixed amount in a mutual fund every month. Your money buys units of the fund at that month’s NAV (Net Asset Value). Do this consistently for 10–20 years, and compound interest does most of the work. A ₹10,000/month SIP at 12% annual return for 20 years grows to approximately ₹99.9 lakhs — on a total investment of ₹24 lakhs.
That gap between ₹24 lakhs invested and ₹99.9 lakhs in returns is not magic. It’s time, compounding, and the discipline of not stopping when markets fall.
What SIP Actually Means
SIP is not a product. It’s a method.
You’re not buying a “SIP” — you’re buying units of a mutual fund (equity, debt, gold, or hybrid) using SIP as the payment mechanism. Think of it the way you think of an EMI, but instead of paying for something you already own, you’re accumulating something that grows.
All mutual funds in India are regulated by SEBI (Securities and Exchange Board of India) and categorized under AMFI (Association of Mutual Funds in India). Every fund you invest in through SIP must comply with SEBI’s disclosure and governance norms. This includes publishing their NAV daily, disclosing their portfolio monthly, and capping the annual expense ratio investors pay.
The NAV is the price per unit of a mutual fund on any given day. If you invest ₹5,000 and the fund’s NAV is ₹50 on that date, you get 100 units. If the NAV is ₹40 next month, your ₹5,000 buys 125 units. This is rupee cost averaging — you automatically buy more units when prices fall and fewer when they rise. Over years, your average cost per unit ends up below the average NAV, which is a genuine mathematical advantage over lump sum investing in volatile markets.
Use our SIP Calculator to see how these numbers play out for your specific monthly amount and timeline.
How SIP Works — Step by Step
- You pick a mutual fund (say, an index fund tracking the Nifty 50)
- You choose a monthly amount — anywhere from ₹100 to no upper limit
- You set a date for the auto-debit (usually 1st, 5th, or 10th of the month)
- On that date every month, your bank deducts the amount and the fund house buys units at that day’s NAV
- Units accumulate in your folio over years
- You can check the current value anytime, pause or stop the SIP, or increase the amount
That’s it. No market-watching required. No decisions to make after setup. This is why SIP works for people who don’t follow markets — the system makes the investment regardless of what the Sensex is doing that month.
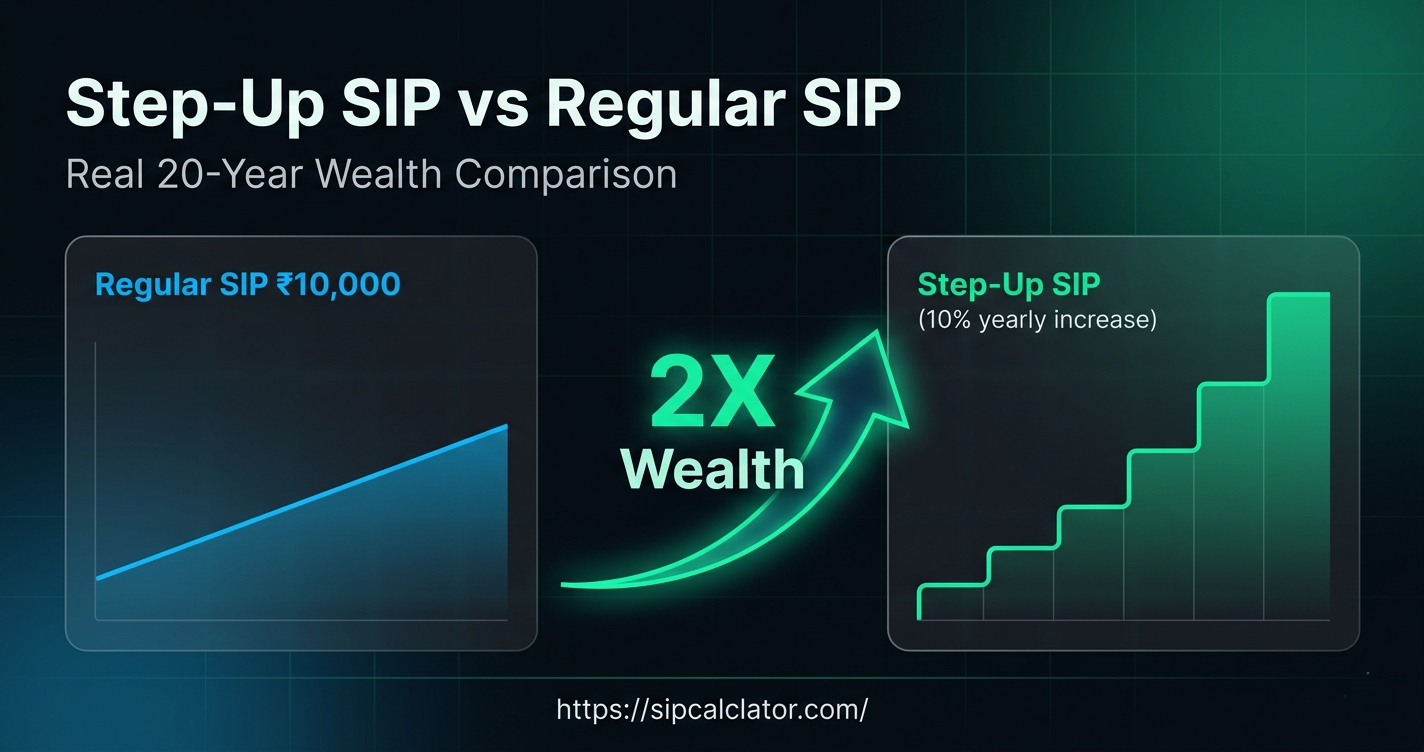
The Step Up SIP Calculator lets you model what happens when you increase this amount by 10% every year — which most financial planners consider the most impactful single decision in a SIP plan.
The SIP Formula (and Why It’s Not Simple Compound Interest)
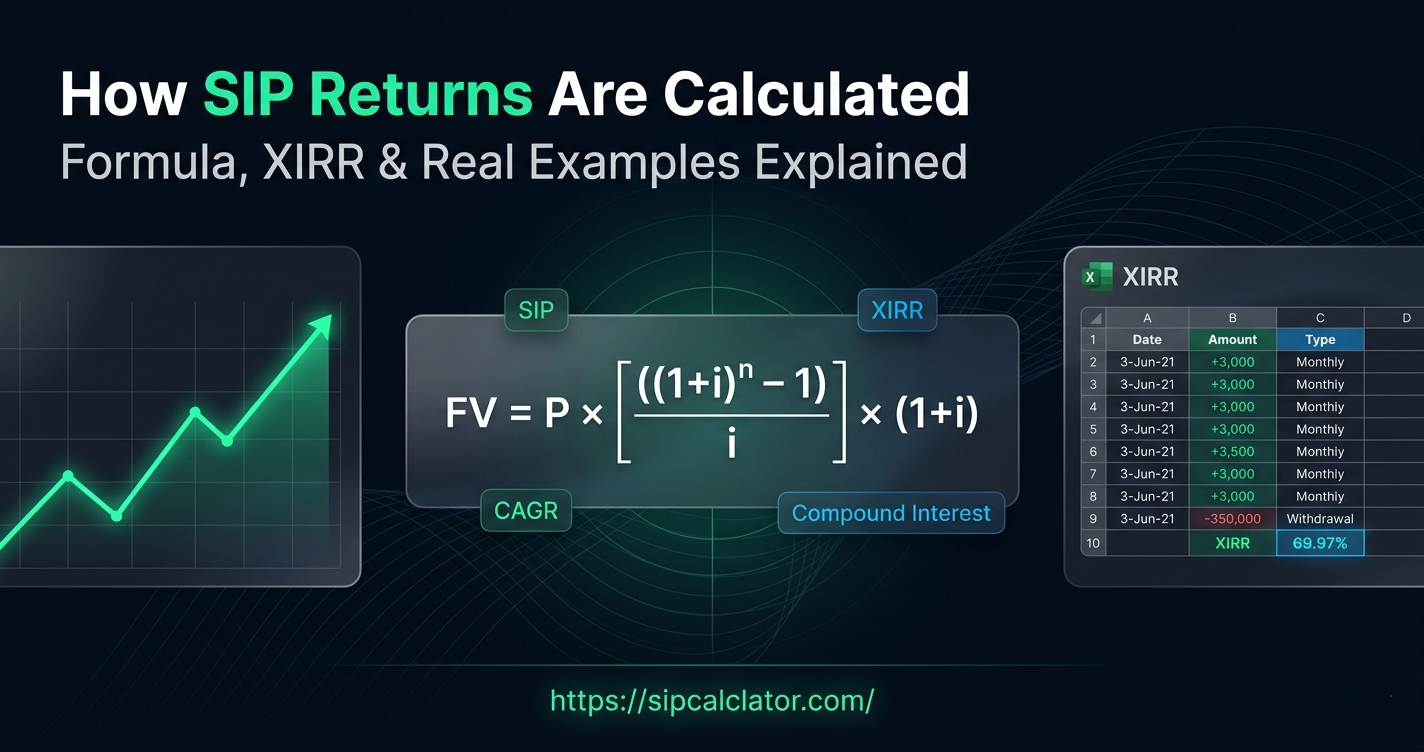
The future value of a SIP is calculated using the future value of an annuity formula:
FV = P × [((1 + i)^n – 1) / i] × (1 + i)
Where:
- P = Monthly SIP amount
- i = Monthly return rate (annual rate ÷ 12)
- n = Total number of months
This formula assumes equal monthly payments at regular intervals. It’s different from simple compound interest (which assumes a single lump sum) because each SIP instalment enters the market on a different date and compounds for a different duration.
Your first ₹5,000 instalment grows for the full 20 years. Your last instalment grows for one month. Every instalment in between grows for a different number of months. This is why the accurate return metric for SIP is XIRR (Extended Internal Rate of Return), not CAGR.
CAGR works for a single lump sum. XIRR accounts for the timing of every individual payment — making it the correct measure for any investment with multiple irregular cash flows. When Groww or Zerodha shows you a return figure in your portfolio, that’s XIRR. It’s the number you should trust over the simple “X% returns” a fund might advertise.
For the lump sum version of this formula, check the Lumpsum Calculator.
What Returns Should You Actually Expect?
The Nifty 50 has delivered approximately 13% CAGR over the last 20 years. That’s the index, not any specific fund. Actual fund returns — after expense ratios — are slightly lower.
Here’s a realistic return table for a ₹5,000/month SIP over different periods:
| Return Rate | 5 Years | 10 Years | 15 Years | 20 Years |
|---|---|---|---|---|
| 8% | ₹3.67L | ₹9.19L | ₹17.37L | ₹29.65L |
| 10% | ₹3.90L | ₹10.33L | ₹20.97L | ₹38.28L |
| 12% | ₹4.12L | ₹11.62L | ₹25.23L | ₹49.96L |
| 14% | ₹4.36L | ₹13.07L | ₹30.40L | ₹65.24L |
Total invested at 5 years = ₹3L | 10 years = ₹6L | 15 years = ₹9L | 20 years = ₹12L
The difference between 10% and 14% over 20 years is ₹26.96 lakhs — from the same ₹5,000/month. This is why fund selection and expense ratio matter, especially over long periods.
A note on realistic expectations: there will be years where your SIP shows negative returns. 2008, 2020 — equity markets fell 30–50%. The instalment you made in October 2008 probably looked terrible for 12 months. By 2010 it had recovered and then some. The math works out over 10+ years. It doesn’t work out if you stop.
Rupee Cost Averaging — The Real Reason SIP Works
Most SIP explainers focus on compounding. The less-discussed advantage is rupee cost averaging.
When you invest ₹5,000 every month without fail, you buy units at every price level. Bull market NAV of ₹100 buys you 50 units. Bear market NAV of ₹60 buys you 83 units. Over three years of monthly purchases, your average cost per unit is lower than the average NAV over that same period — because you automatically bought more at the lower prices.
This doesn’t eliminate market risk. A prolonged downturn still hurts. But it means the investors who kept their SIP running through 2020’s March crash bought a lot of units at very low NAVs — units that were worth significantly more by December 2020.
The one habit that destroys rupee cost averaging: stopping SIP when markets fall. That’s exactly when it’s most effective.
Types of SIP You Can Set Up
Regular SIP
Fixed amount, fixed date, runs until you stop it. The default for most investors.
Step-Up SIP
Amount increases by a fixed percentage annually. Starting at ₹10,000/month with 10% step-up takes you to ₹61,160/month by year 20. The corpus nearly doubles compared to a flat SIP. See exact numbers on the Step Up SIP Calculator.
Perpetual SIP
No end date. Runs indefinitely. Useful if you plan to invest until retirement without revisiting the setup.
ELSS SIP
SIP into an Equity Linked Savings Scheme. Each instalment qualifies for Section 80C deduction up to ₹1.5 lakh/year. The trade-off: each instalment has a 3-year lock-in.
Flexible SIP
You change the amount each month based on your cash flow. Useful for freelancers and business owners with variable income.
SIP Tax — What You Actually Pay
Equity mutual fund gains on SIP units held over 12 months are taxed at 12.5% LTCG on gains above ₹1.25 lakh per year (post Budget 2024, revised from the earlier 10%/₹1L threshold).
Units held under 12 months: 20% STCG tax.
The important nuance for SIP: each monthly instalment has its own purchase date. Units from month 1 are 12 months old after month 12. Units from month 6 are 12 months old after month 18. When you redeem, the oldest units are redeemed first (FIFO basis) — which typically means LTCG tax applies to most of the redemption amount for long-running SIPs.
Debt fund SIP units: taxed at your income slab rate regardless of holding period. The pre-2023 indexation benefit no longer applies.
This calculator and all our tools show pre-tax projections. For post-tax planning, reduce your effective return assumption by 1–2%.
SIP vs Lumpsum — When Each Makes Sense
SIP wins in volatile or sideways markets through rupee cost averaging. Lumpsum wins in a sustained bull market because the full amount compounds from day one.
For most salaried investors, SIP is the practical default — you invest from monthly income, avoid market timing pressure, and build discipline automatically. When you receive a windfall — bonus, inheritance, matured FD — that’s the lumpsum moment. Use the Lumpsum Calculator to compare.
Many investors combine both: a running SIP for the baseline, and occasional lumpsum additions during market corrections.
How to Start a SIP in India
You need: PAN card, Aadhaar, and a bank account. Full KYC takes 10–15 minutes on most platforms. After that, picking a fund and setting up the SIP takes another 5 minutes.
Platforms that support SIP:
- Groww — beginner-friendly, clean interface
- Zerodha Coin — direct plans, no commission
- Kuvera — free, direct plans, excellent portfolio tracking
- Paytm Money — straightforward onboarding
- Direct fund house websites (HDFC, Mirae Asset, Parag Parikh)
Once the SIP is set up, the only thing left is to not touch it when markets fall. That’s not a joke — it’s the primary behavioural challenge that separates investors who build wealth from those who don’t.
SWP: When You’re Ready to Withdraw
The other side of SIP is SWP — Systematic Withdrawal Plan. Once you’ve built the corpus, SWP lets you withdraw a fixed monthly amount while the remaining balance stays invested and keeps earning returns. It’s the income phase that SIP’s accumulation phase leads to. Our SWP Calculator shows how long your corpus lasts at any withdrawal rate.
Frequently Asked Questions
What is SIP in mutual funds?
SIP is a method of investing a fixed amount in a mutual fund every month. Your money buys units at that month’s NAV. Over time, you accumulate units through regular purchases — more when prices are low, fewer when prices are high. This is rupee cost averaging, and it removes the need to time the market.
How does SIP work step by step?
You choose a fund, set a monthly amount, pick a debit date, and the rest is automated. Each month the amount is debited, fund units are purchased at the current NAV, and they’re added to your folio. You can stop or pause anytime for most open-ended funds.
What is the minimum SIP amount?
Most platforms accept SIPs from ₹100–₹500. HDFC Nifty 50 Index Fund accepts from ₹100. Parag Parikh Flexi Cap and Mirae Asset start at ₹1,000. There is no maximum limit.
What returns can I expect from SIP?
Equity fund SIPs have historically delivered 10–14% XIRR over 10-year periods. The Nifty 50 has compounded at approximately 13% CAGR over the last 20 years. Debt fund SIPs return 6–8%. No return is guaranteed — these are historical figures.
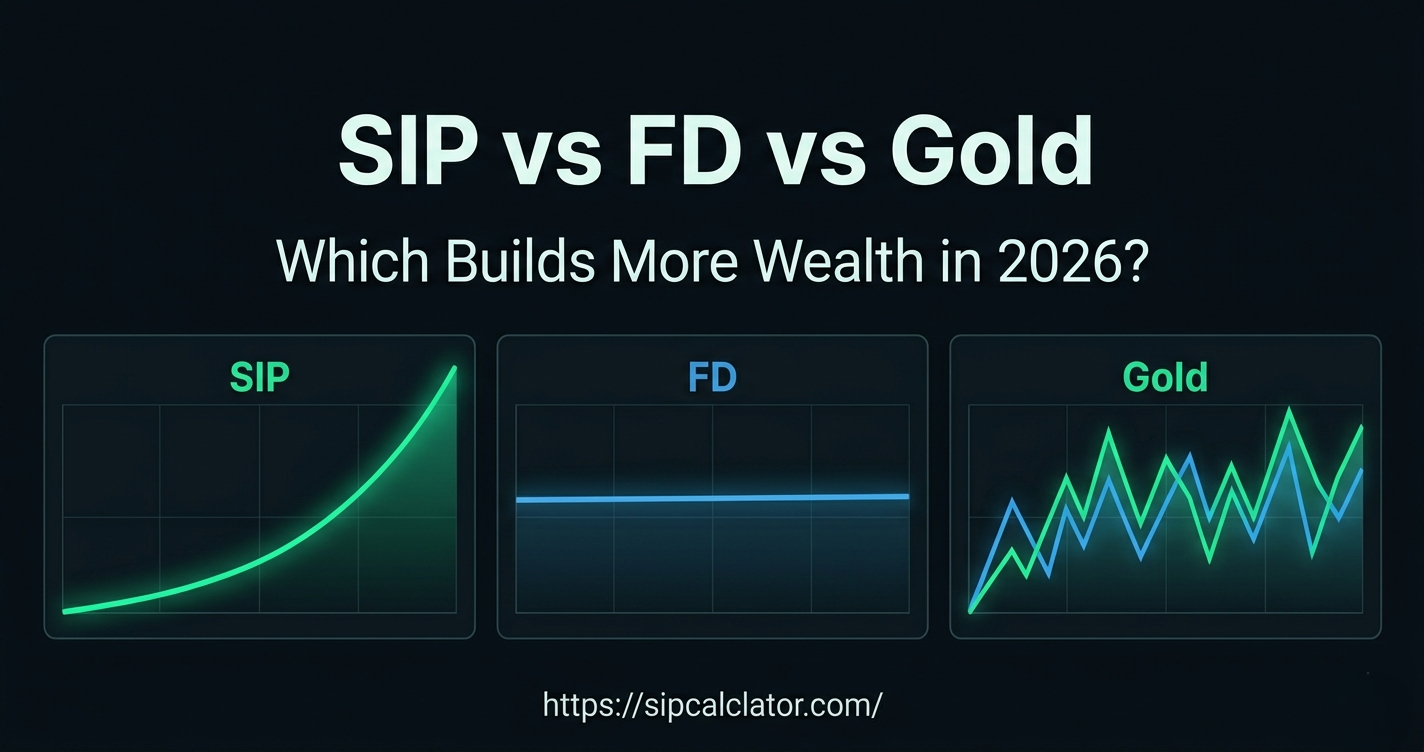
Is SIP better than FD?
For 10+ year goals, equity SIP has consistently returned more than FD. FD interest is fully taxable at your slab rate. SIP LTCG is 12.5% only on gains above ₹1.25 lakh per year. For goals under 3 years or where capital safety matters more than growth, FD is the right choice.
What is XIRR in SIP?
XIRR is the accurate return metric for SIP. Each monthly instalment compounds for a different duration — XIRR accounts for the exact timing of every payment and gives the true annualised return. It’s what Groww and Zerodha show on your portfolio dashboard.
Can I stop SIP anytime?
Yes, for most open-ended funds. ELSS has a 3-year lock-in per instalment. Some funds charge an exit load of 0.5–1% if you redeem within 12 months. Check your fund’s scheme information document before starting.
What is rupee cost averaging?
It’s what happens when you invest a fixed amount monthly regardless of market conditions. High NAV = fewer units. Low NAV = more units. Over time, your average cost per unit ends up below the arithmetic average NAV — because you bought more at lower prices automatically.
This article is for educational purposes only. SIP returns are subject to market risk. Actual returns depend on fund selection, market conditions, and investment duration. Past performance is not indicative of future results. LTCG and STCG tax implications apply. Consult a SEBI-registered financial advisor for personal investment planning.